NET has many tools for monitoring and instrumentation. One of them is the CLI (command-line interface) tool dotnet-counters.
It’s an excellent tool for first-level ad hoc performance monitoring. It allows you to observe performance counter values published via the EventCounter API or the Meter API.
You can quickly monitor CPU usage, GC Heap Size, requests per second, and many more.
It’s a tool for an early investigation before using more advanced tools like dotnet-trace or PerfView.
To use dotnet-counters, you need to install them first.
dotnet tool install --global dotnet-counterslist
A good start is the list command. It displays a list of counter names and descriptions.
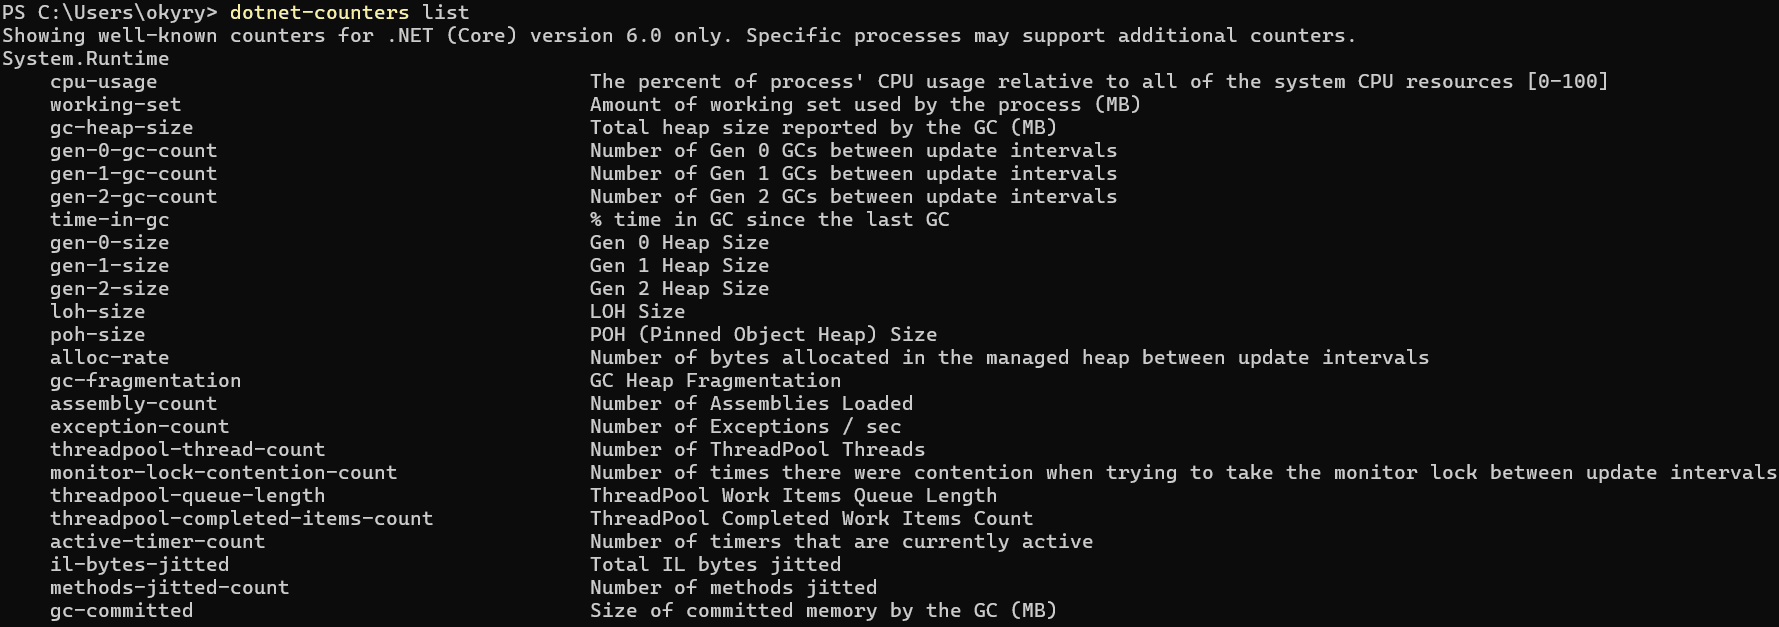
As you can see, the System.Runtime provider has a lot of counters to observe.
Let’s take a look at ASP.NET Core providers.
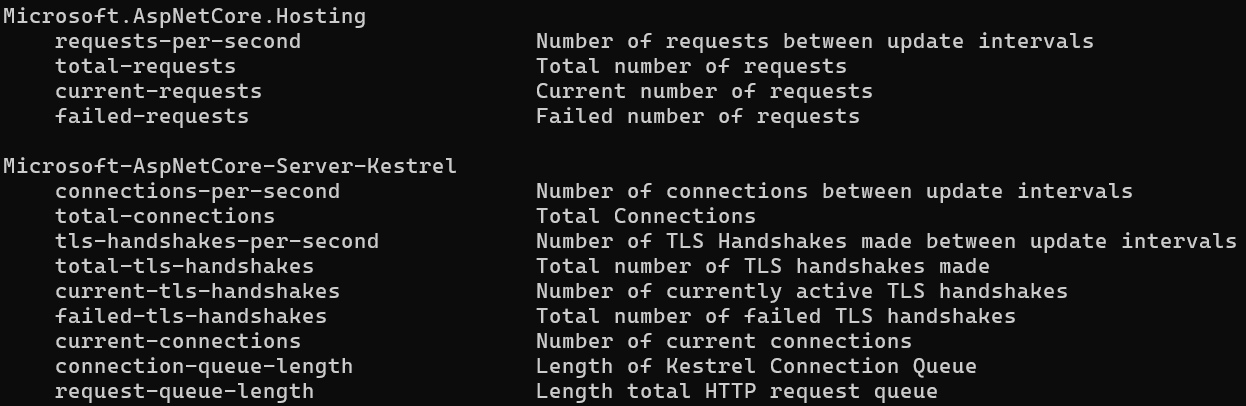
It’s not a complete list. I encourage you to install the dotnet-counters tool and explore all default counters.
ps
To monitor your app’s counters, you’ll need its Process ID. You can find it in the Task Manager, but many different processes exist.
Use the ps command to find Process IDs more easily. It displays the dotnet processes that can be monitored.
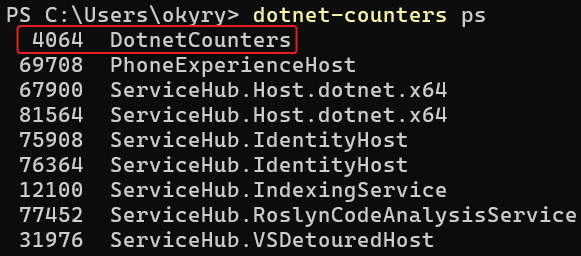
You can see my running a simple console application, DotnetCounters. It has Process ID 4064.
monitor
Let’s monitor it!

The monitor command displays counter values in real-time and periodically refreshes them. You can specify the counters you want to observe with the –counters parameter and change the refresh interval with the –refresh-interval parameter.
collect
The collect command allows you to collect the counter values and save them into a file.
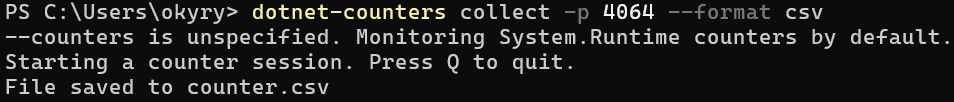
The collect command has the same parameters as the monitor command. Additionally, you can specify the output file with the -o|–output parameter and the file format with the –format parameter (currently available CSV and JSON formats).
As you can see, the dotnet-counters tool is simple to use but powerful. It’s an excellent addition to your tool belt, helping you investigate and monitor your application’s performance.